Water & Coastal Survey Expertise
Hydrographic surveys measure water depths and map underwater features. Unlike land surveys where you can see the ground, underwater surveys use sonar (sound waves) to create maps of lake beds, river channels, and dam reservoirs. This data is essential for understanding water storage capacity, planning coastal construction, and assessing flood risk.
We provide bathymetric surveys for dams, reservoirs, rivers, lakes, and coastal areas. Essential for irrigation schemes needing to know water storage capacity, counties assessing flood risk, coastal developers planning jetty construction, and environmental projects monitoring water body health.
Hydrographic Survey Services
Dam Volume & Siltation Monitoring
Bathymetric surveys measuring reservoir capacity. We calculate water storage volumes, monitor siltation rates over time, assess dam safety and operational capacity, and plan dredging operations
Coastal Bathymetric Surveys
Underwater mapping for coastal development. Services include jetty and harbor construction planning, navigational charting, coastal erosion monitoring, and marine boundary demarcation
River Channel Profiling
Cross-section surveys for bridge design. We provide channel depth and width measurements, flood modeling data, irrigation canal planning, and sediment transport analysis
Lake Bed Mapping
Lake Victoria and inland water bodies. Services include depth contour mapping, navigation safety charts, fishing zone identification, and environmental baseline studies
Water Resource Assessment
Volume calculations for irrigation planning. We provide water storage capacity evaluation, seasonal variation monitoring, and climate change impact assessment
Flood Inundation Modeling
GIS-based flood risk mapping. We identify areas at risk during heavy rainfall, support early warning systems, and assist with infrastructure planning for flood resilience
Survey Equipment & Technology
Single-Beam Echo Sounder
Measures depth directly below the boat using a single sonar beam. Ideal for narrow rivers, small dams, and detailed cross-sections. Use: Point measurements along survey lines, economical for small water bodies
Multi-Beam Echo Sounder
Measures a wide swath of depths simultaneously using multiple sonar beams. Provides complete bottom coverage, no gaps between survey lines. Use: Large reservoirs, coastal areas, complete lake bed mapping
RTK GPS Positioning System
Real-time kinematic GPS provides centimeter-level positioning for each depth measurement. Essential for accurate underwater mapping. Use: Georeferencing all depth points, creating accurate contour maps
Tide Gauges & Water Level Sensors
Monitors water surface elevation during survey. Corrects depth readings to a consistent vertical reference (like mean sea level). Use: Ensuring all depths relate to same reference level, critical for volume calculations
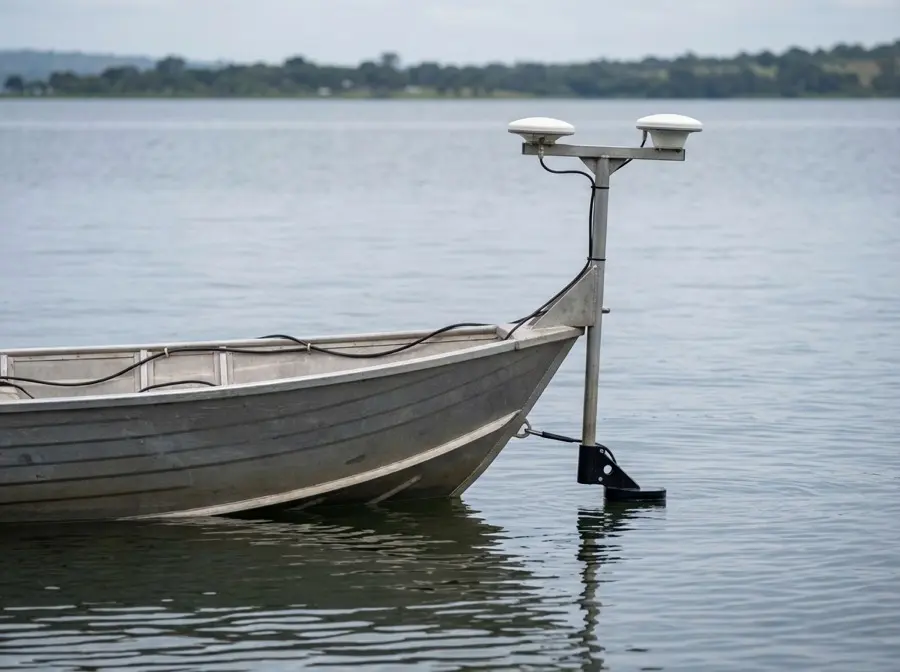
Survey Launch & Navigation
Specialized boat equipped with sonar, GPS, and data collection systems. Stable platform essential for accurate measurements. Use: Accessing water bodies, maintaining straight survey lines, safe operation
Hydrographic Processing Software
Specialized GIS and bathymetric software for data processing. Cleans raw sonar data, creates depth contours, calculates volumes. Use: Producing depth maps, volume reports, cross-sections, navigational charts
Who Needs Hydrographic Surveys
Dam Owners & Irrigation Schemes: Capacity monitoring, siltation assessment, operational planning
County Governments: Water resource management, flood risk mapping, coastal planning
Coastal Developers: Jetty construction, harbor planning, resort development
Fishing Industry: Navigational charts, fishing zone mapping, safe passage identification
Environmental Projects: Baseline studies, water quality sampling point positioning, ecological monitoring
Infrastructure Projects: Bridge design river profiling, pipeline crossings, canal planning
Technology & Methods
Single-beam and multi-beam echo sounders for depth measurement, RTK GPS for precise positioning, tide gauges for water level monitoring, survey launch for water body access, GIS integration for depth contour mapping and volume calculations. Deliverables include depth contours, volume reports, siltation analysis, and navigational charts.
Real-World Project Scenarios
Irrigation Scheme Dam Siltation Assessment
Need: A farmers' cooperative operates a 30-year-old earth dam. Water runs out mid-season despite normal rainfall. They suspect siltation has reduced storage capacity but need to know by how much. Deliverables: Bathymetric survey comparing current reservoir volume to original design capacity. Siltation rate analysis showing cubic meters of sediment accumulated. Recommendations for dredging zones and estimated costs. Updated storage curves for water allocation planning.
Coastal Resort Jetty Construction
Need: A beach resort developer wants to build a boat jetty for water sports and excursions. They need to know seabed depth, bottom material (rock, sand, coral), and wave exposure at proposed jetty location. Deliverables: Nearshore bathymetric survey showing depth contours from beach to 50 meters offshore. Seabed classification from sonar returns (hard rock, soft sediment). Cross-sections along proposed jetty alignment for foundation design. Navigational chart showing safe approach depths for vessels.
River Bridge Design for Road Contractor
Need: A road construction company is designing a bridge crossing the Tana River. Engineers need river channel profile data for pier placement, scour depth estimation, and flood clearance calculations. Deliverables: River cross-sections at 20-meter intervals across 500-meter bridge corridor. Longitudinal profile showing thalweg (deepest channel). High-water level survey during wet season. Sediment analysis for scour risk assessment. Data formatted for AutoCAD Civil 3D import.
County Government Flood Modeling
Need: A county water department is creating flood hazard maps for urban planning. They need accurate river channel data and topography of floodplain areas to model inundation scenarios. Deliverables: Combined bathymetric (river channel) and topographic (floodplain) survey. GIS-ready elevation model showing seamless land-water surface. Cross-sections at bridge locations and critical infrastructure. Flow area calculations for hydraulic modeling in HEC-RAS or similar software.
Environmental NGO Lake Baseline Study
Need: An environmental organization is monitoring lake health and needs baseline bathymetric data to track sediment accumulation, identify deep-water habitat zones, and plan water quality sampling locations. Deliverables: Complete lake bed bathymetric map with 1-meter depth contours. Volume calculation by depth zone for habitat classification. Identification of deep basins (anoxic zones) and shallow littoral areas. Recommended sampling point locations at representative depths. GIS layers for long-term monitoring.
Common Questions About Hydrographic Surveys
What is bathymetry? +
Bathymetry is the measurement of water depth and the mapping of underwater surfaces. Think of it as topographic mapping, but for the bottom of lakes, rivers, dams, and oceans. The word comes from Greek: bathos (depth) and metron (measure). Bathymetric surveys create contour maps showing underwater valleys, ridges, channels, and flat areas, just like topographic maps show mountains and valleys on land.
How do you measure water depth accurately? +
We use sonar technology called echo sounding. An echo sounder sends a sound pulse from a transducer mounted below the boat. The sound travels through the water, bounces off the bottom, and returns to the transducer. The device measures the time between sending and receiving the pulse. Since sound travels through water at a known speed (about 1,500 meters per second, varying with temperature and salinity), we calculate depth from travel time. RTK GPS records the exact position of each measurement. Tide gauges correct for changing water levels. This combination produces centimeter-accurate underwater maps.
What is siltation and why does it matter? +
Siltation is the accumulation of sediment (silt, sand, clay) on the bottom of water bodies. Rivers carry sediment into reservoirs, where slow-moving water causes particles to settle. Over years, this sediment builds up, reducing water storage capacity. A dam designed to hold 10 million cubic meters might only hold 6 million after 20 years of siltation. This affects irrigation water availability, hydropower generation, and flood control. Regular bathymetric surveys measure siltation rates, identify problem areas, and guide dredging operations to restore capacity.
Can you survey moving water like rivers? +
Yes, but with special considerations. River surveys account for water velocity and require careful boat navigation to maintain accurate positioning. We typically survey during low-flow periods when currents are manageable. For fast-flowing sections, we use RTK GPS with motion compensation to correct for boat drift. River surveys focus on cross-sections (bank to bank profiles) rather than complete area coverage. These cross-sections provide critical data for bridge design, flood modeling, and sediment transport analysis. We have surveyed major Kenyan rivers including Tana, Athi, and coastal estuaries.
What deliverables will I receive? +
You receive comprehensive mapping and analysis products. Bathymetric contour maps show depth at regular intervals (0.5m, 1m, or 2m contours depending on project). Volume reports calculate total storage capacity and siltation volumes. Cross-section drawings show underwater profiles at specified locations. GIS data layers compatible with ArcGIS, QGIS, and AutoCAD Civil 3D. 3D surface models for visualization and engineering design. Siltation analysis comparing current survey to historical data or design drawings. Navigational charts for coastal or lake projects. All deliverables include metadata on survey date, equipment used, accuracy achieved, and vertical reference datum.
How much does a hydrographic survey cost? +
Cost depends on water body size, depth range, access difficulty, and accuracy requirements. Small farm dams (under 5 hectares) typically cost KES 200,000 to 400,000. Medium irrigation reservoirs (5-20 hectares) range from KES 400,000 to 1,000,000. Large reservoirs or coastal surveys exceed KES 1,000,000 depending on scope. River surveys are priced by linear kilometers and cross-section spacing. Factors affecting cost include: distance from our base (mobilization costs), boat launch availability (we may need to transport our launch), vegetation or debris requiring clearing, required turnaround time, and deliverable complexity. Contact us with your project location, approximate water body size, and objectives for a detailed quotation.
Need Dam, River, or Coastal Survey?
Hydrographic survey costs depend on water body size, depth range, access conditions, and required accuracy. Small dam surveys from KES 200,000+. Large reservoir or coastal projects from KES 500,000+. Contact us for project-specific pricing.